heartbreaker@lemmy.world to Linux@lemmy.ml · edit-21 year agoWhat is happening in Norway, and how do we spread it?lemmy.worldimagemessage-square148linkfedilinkarrow-up1785arrow-down18file-text
arrow-up1777arrow-down1imageWhat is happening in Norway, and how do we spread it?lemmy.worldheartbreaker@lemmy.world to Linux@lemmy.ml · edit-21 year agomessage-square148linkfedilinkfile-text
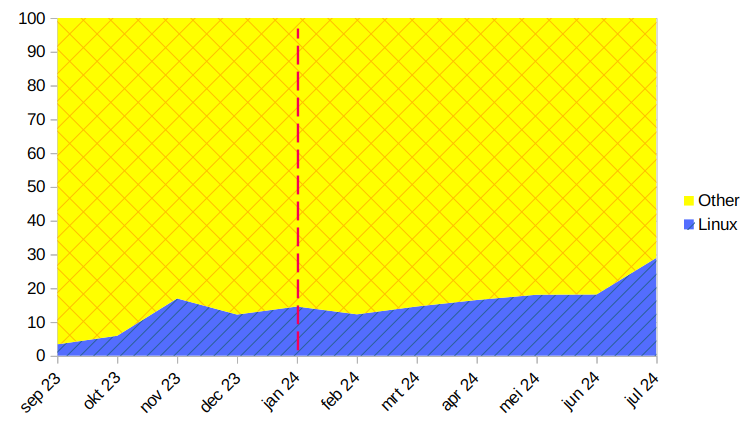
minus-squareheartbreaker@lemmy.worldOPlinkfedilinkarrow-up25·1 year agoI downloaded the data from globalstats statscounter
minus-squareBeaver@lemmy.caBanned from communitylinkfedilinkEnglisharrow-up1·edit-21 year agoHow do you make the graph? What type of graph is it? So I can use it for browser marketshare and search engine marketshare.
minus-squareheartbreaker@lemmy.worldOPlinkfedilinkarrow-up2·1 year agoYou can download the .csv data from the website. Then make a stacked area chart in something like Excel/Google Sheets/Libreoffice Calc.


I downloaded the data from globalstats statscounter
How do you make the graph? What type of graph is it?
So I can use it for browser marketshare and search engine marketshare.
You can download the .csv data from the website. Then make a stacked area chart in something like Excel/Google Sheets/Libreoffice Calc.